Monday, 4 June 2012

The ‘autism epidemic’ and diagnostic substitution

Based on: King & Bearman (2011) American Sociological Review, 76(2), 320-346; 
Data from birth and diagnostic records for all children born in California 1992-2000
Everyone agrees there has been a remarkable increase in autism diagnosis across the world. There is, however, considerable debate about the reasons for this. Three very different kinds of explanation exist.
  • Explanation #1 maintains that something in our modern environment has come along to increase the risk of autism. There are numerous candidates, as indicated in this blogpost by Emily Willingham
  • Explanation #2 sees the risks as largely biological or genetic, with changing patterns of reproduction altering prevalence rates, either because of assortative mating (not much evidence, in my view) or because of an increase in older parents (more plausible). 
  • Explanation #3 is very different: it says the increase is not a real increase - it’s just a change in what we count as autism. This has been termed ‘diagnostic substitution’ - the basic idea is that children who would previously have received another diagnosis or no diagnosis are now being identified with autism spectrum disorder (ASD). This could be in part because of new conceptualisations of autism, but may also be fuelled by strategic considerations: resources for children with ASD tend to be much better than those for children with other related conditions, such as language impairment or intellectual handicaps, so this diagnosis may be preferred.
In 2008, my research group published a study that documented one kind of diagnostic substitution. We contacted people who had taken part in our studies of children with specific language impairment years ago. We carried out a standard diagnostic observation procedure for autism with the young adults themselves and, where possible, interviewed their parents about their early history. We found a number of individuals who had been regarded as cases of specific language impairment ten or twenty years ago but who would nowadays be diagnosed with ASD. Although it’s possible that some people develop autistic symptomatology as they get older, in our cases the autistic symptoms appeared to have been present from early childhood - as indicated by the parental interviews. Around half of the sample had been identified as having ‘semantic-pragmatic disorder’ in childhood, but autism had been excluded because at that time, prior to publication of DSM-IV diagnostic guidelines, it was regarded as a very rare condition in which there were severe social and behavioural impairments. How many children would have qualified for ASD diagnoses had they been seen today? Well, it depends. I suspect few people appreciate just how flexible the diagnostic criteria are for autism, even when lengthy standardized diagnostic instruments are used. Although we used the gold standard diagnostic procedures (ADOS-G and ADI-R) we found they seldom gave the same answer. If we diagnosed ASD only when both diagnostic instruments agreed, 21% of cases met criteria. If we included anyone who met criteria for autism or PDDNOS on either ADI-R or ADOS, the rate shot up to 66%.
Last year, a fascinating study by Brugha and colleagues attacked the same question from a different angle. They did an epidemiological survey of a representative sample of adults from the English population, using the ADOS-G, and found that the rates of ASD were similar to those recently reported in children. Within the adult population, rates of ASD did not change with age. Thus, provided we stick to the same diagnostic criteria, then the prevalence of autism is the same for those born several decades ago, as it is for the current generation of children. Importantly, none of these adults with ASD had received a formal diagnosis.
Recently, we conducted a study with another group: children with an additional sex chromosome (i.e. trisomy). We had not intended to study diagnostic substitution: the goal was rather to understand more about the language difficulties that had previously been described in children with sex chromosome trisomies. The effect of an extra sex chromosome is relatively mild: most of these children attend mainstream schools and they do not have any obvious physical abnormalities. Indeed, they can be hard to study because many individuals with trisomies will be unaware of their condition. We gathered information by parental report, and did not do any direct evaluation of the child, but we did ask about whether the child had had any kind of diagnosis by a medical or psychological expert. We confirmed that there was a strong association with language problems in all three kinds of trisomy (girls with XXX, and boys with XYY or XXY), many of whom had had speech-language therapy. But we also found that 2/19 (11%) of boys with XXY and 11/58 (19%) of those with XYY had received an ASD diagnosis.
It is important to emphasise that most children with a sex chromosome trisomy did not have an ASD diagnosis, and many were not giving any cause for concern. Nevertheless, although they are only a minority of cases, the proportion with ASD is much higher than in the general population. We were really surprised at this because before publishing our study we had done a systematic review of the literature on children with sex chromosome trisomies, focusing on studies that avoided ascertainment bias. In these studies, not a single case of autism had been mentioned when discussing outcomes. So was our study a fluke? We are confident this is not the case, because this year two further studies from the USA have been reported (Ross et al and Lee et al, in press), both of which got results very similar to ours, though using different methods.
This research provides further evidence that diagnostic substitution has occurred, suggesting that children who in the past would have been diagnosed with language impairment are now being diagnosed with ASD. The only other way to explain the increased diagnosis rate in children with a known chromosomal abnormality would be if the trisomy acted as a risk factor, making children more sensitive to environmental factors that could cause autism. That’s a possibility, but it seems more likely that cases of ASD were missed in the past because more stringent diagnostic criteria were used, just as was found in our follow-up of children with SLI and in the epidemiological study of adults by Brugha and colleagues.
It is becoming clear that changing diagnostic criteria, increased awareness of ASD, and strategic use of diagnosis to gain access to services, have had a massive effect on the numbers of children with ASD. When I started studies in this area, I thought diagnostic substitution had happened but I did not think it would be sufficient to explain the increase in numbers of ASD diagnoses. But now, on the basis of studies reviewed here, I think it could be the full story.

PS: a slightly extended version of this blogpost was featured on PLOS Blogs on 8th June 2012.

References
Bishop, D., Jacobs, P., Lachlan, K., Wellesley, D., Barnicoat, A., Boyd, P., Fryer, A., Middlemiss, P., Smithson, S., Metcalfe, K., Shears, D., Leggett, V., Nation, K., & Scerif, G. (2010). Autism, language and communication in children with sex chromosome trisomies Archives of Disease in Childhood, 96 (10), 954-959 DOI: 10.1136/adc.2009.179747
 
Bishop, D., Whitehouse, A., Watt, H., & Line, E. (2008). Autism and diagnostic substitution: evidence from a study of adults with a history of developmental language disorder Developmental Medicine & Child Neurology, 50 (5), 341-345 DOI: 10.1111/j.1469-8749.2008.02057.x  

Brugha, T. (2011). Epidemiology of Autism Spectrum Disorders in Adults in the Community in England Archives of General Psychiatry, 68 (5) DOI: 10.1001/archgenpsychiatry.2011.38

Lee, N. R., Wallace, G. L., Adeyemi, E. I., Lopez, K. C., Blumenthal, J. D., Clasen, L. S., & Giedd, J. N. (2012, in press). Dosage effects of X and Y chromosomes on language and social functioning in children with supernumerary sex chromosome aneuploidies: Implications for idiopathic language impairment and autism spectrum disorders. Journal of Child Psychology and Psychiatry

Ross, J. L.,et al (2012). Behavioral and social phenotypes in boys with 47, XYY syndrome or 47, XXY Klinefelter syndrome.  Pediatrics, 129(4), 769-778. doi: 10.1542/peds.2011-0719


Monday, 21 May 2012

Well, this should be easy….

 Life and times of an amateur video-maker


It’s been an exciting week. On Friday, a small group of us launched a campaign to raise awareness of children’s language learning impairments (RALLI). We’ve been fortunate to have had considerable help from TeamSpirit, an agency whose expertise in marketing and advertising has been invaluable. With their assistance, we’ve set up a YouTube channel, which has kicked off with some professionally-made video shorts to introduce the campaign. But we don’t have funds to continue with a lot of expensive professional services, and so our plan is to post a mix of content on the site, including some videos made by the RALLI team. We are four academics and a speech-and-language therapist, none of whom has any expertise in filming, but the TeamSpirit folks were reassuring. What we needed was a digital flipcam, which would allow us to film ourselves in high definition video, download to the computer, and upload to YouTube. Easy peasy. Or so I thought. Before I began this exercise, I was a straightforward atheist. Now I believe in supernatural forces, but they aren’t benign.
The camera arrived in the post and looked great - same size as a mobile phone. I studied the manual. There was a battery. There was a slot labelled ‘battery compartment’. But there was a problem. The battery did not fit in the battery compartment, whichever way I tried. I grumbled to my PA that we’d been sent the wrong battery. She discovered a bit of the manual that explained how to insert the battery - in a quite different place. I left her to play with the camera while I went off to prepare a lecture, as she was clearly more suited to this than me. She emailed me to say that the camera worked well, but there was a snag. It stored exactly 30 seconds of footage. Should you want more than this, you had to buy a memory card. This is what went in the ‘battery compartment’. So, my plans for starting filming were foiled.
Onto the Kodak website. Astounded by how much I’d have to pay for a memory card. Realised I’d also need some kind of tripod to stabilise the camera when filming myself. Registered on the website, put in an order, tried to pay with Paypal, password rejected. Having assumed various emails from Paypal were spam, I was now uncertain as to whether or not my recorded password was still valid. But I wasn’t going to get a chance anyhow, as my failed password had somehow aborted the whole operation. Too busy to start again, so decided I’d take a look in Currys to see if I could buy memory etc.
The Currys option was the only positive thing to happen. Found a dinky little cushion thing that you could screw your camera into that cost far less than a tripod and worked as well. Also found that, as I didn’t plan to record hours of footage, I could buy a small memory card much more cheaply. So I was ready to go except for one thing. I needed an external microphone.
We had had a clearout of our lab a few months ago, during which we’d found a huge cache of microphones. For years we did research on language disorders that involved making good quality tape-recordings of children, and we had clip-on microphones, boundary microphones, big microphones, small microphones, none of which had been used for years. However, they had all been carefully put away. Somewhere. I thought I was getting close when I found a box full of headphones, but no. Several boxes later, I gave up. I wonder if other people have boxes full of cables that connect together things that you have never used, have no idea what they’re for, but can’t bear to throw away.
Eventually, a savvy member of my team arrived and located a boundary microphone, which I took home with me to experiment with over the weekend. Well, I guess this microphone had once been good, but it had lived in a box for about 8 years. I assumed that the little round battery in it was now well dead, but there were a couple of spare batteries still in their original packaging. Like most contemporary packaging, this  was designed to give you the impression that if you attack it with fingernails, you might get in, when in fact this is not the case. The only result is a broken fingernail. What is needed is scissors, and so I now went on a scissor-hunt. Eventual success, though why scissors should be in the fruit bowl I do not know.  
No indication as to which way round the battery should go, and I’d made the mistake of removing the existing one without checking. Tried new battery one way up. Nothing. But now a problem. The battery sat happily in the battery hole and did not want to come out. Tried fingernails, tried prodding with nail-scissors. It wobbled, but it wouldn’t budge. Gave to husband. He tried fingernails, and tried scissors. Then he had a remarkable insight. “What we need,” he said, “is a magnet”. This seemed to me no more than a theoretical speculation of no practical relevance. But he went further, and demonstrated his true genius in lateral thinking. “We need the little red man.” The little red man is a fridge magnet that we’d been given for Christmas. Downstairs to the kitchen again. The red man’s magnetic feet proved to be the perfect size for extracting little round batteries from microphones. We removed the battery. We rotated the battery. We reinserted the battery and plugged the microphone into the flipcam. Made a recording. Couldn’t hear any sound. What we now needed, clearly, was headphones. Headphone-hunt ensued. Headphones eventually located in the bedroom. Plugged in. Well, there was sound, but it was very faint. I tried modifying the controls on the flipcam to improve the gain, but that had  minimal effect. Here my amateur knowledge of technology failed me. If it was faint, could it mean that the battery was running out of juice? Husband thought unlikely but we did have one more spare battery to try. Another assault on packaging with scissors and we were in. We had another go with red Pete’s feet, but the new battery didn’t work at all. At this point it was getting late and husband was impatient to watch another episode of Breaking Bad (highly recommended: we are on series 3), so I gave up for the night.
Next morning decided to look in the geological specimen cabinet to see if I could find an alternative battery. This is an amazing piece of furniture that we picked up in a country auction about 30 years ago. Its original function was to store bits of rock, but it is a godsend for a hoarder, as it allows you to hoard your useless objects in labelled mahogany drawers. One drawer is called Batteries. The problem is that the batteries that live in it tend to be very old, but I did find some that were small and round and labelled as “For use only in NHS hearing aids.” Husband, who has a hearing aid, denied all knowledge of them. Ever optimistic, I decided to try one in my microphone, feeling ever-so-slightly wicked at disobeying the stern injunction on the packet. The battery fitted in the microphone slot very snugly. I tried recording. I got a signal, but it was even weaker than before. Oh well, I thought, maybe I should just buy a new battery. But then I had a problem. The snugly fitting NHS battery was wedged in. Even the full force of red Pete’s feet would not budge it. I felt that God was punishing me for misappropriating NHS property and sadly decided that the boundary microphone would have to be ditched, and I should just get myself a clip-on microphone (which was what TeamSpirit had originally recommended….).
Off I trotted to Currys. “No”, they said, “We don’t do microphones. You could try Maplins on the Botley Road.” This entailed a trip in the car, but, after standing for 10 minutes in a queue while the extraordinarily helpful Maplin’s staff explained some complicated electronic device to a customer, I was armed with my microphone and ready to go. Quick test when I got home and it worked! Excellent clear signal. So I should be able to make the two short video clips that I had undertaken to do.
Now my only problem was to perfect a three-minute spiel and record myself saying it in front of the camera. Well, there was another problem, which is that my usual weekend appearance is scruffy. I do scruffy very well. It’s my natural state. But if I was going to be recorded for posterity, I needed to try and look professional. I realised that only my top half would be visible, so put on smart top, jewellery and make-up. Husband wandered in at some point: surprised to see me dressed up but clearly thought I had just forgotten to change from track-suit trousers, which says much about my usual level of absent mindedness. Arranged camera on a stepladder to capture head-and-shoulders region, checked light levels, sat in chair, breathed in ready to start spiel, and … the phone rang. Blood transfusion service, wanting me to make an appointment to give blood. Go downstairs, find diary, make appointment. Start again.
The thing about talking in front of a video for three minutes is that it’s quite easy to do it for about two minutes, but then you snarl up. I had two takes that were near-perfect but where I then descended into gibberish. There was also one take where the top of my head was chopped off, and another where I forgot to plug in the microphone. But eventually, I had a version with just a minor stumble in the middle which I decided I could live with. So now, I just had to import it into my computer. Quick hunt for the instruction manual, eventually located underneath a newspaper. Cunningly designed camera has USB connector that you can pull out of slide slot: neat! You put it in your computer, which allows you to download the software that you need to edit your video. This gives instructions for yet other software that you need to find on the web. You download that and restart the computer as instructed. You then get a cheerful message to tell you that there’s a new version of your software, and would you like to download an update now. “No I would not!” I say sternly to the screen, determined to press on now I’ve got started. I’m confused as to the distinction between the two bits of software, but eventually manage to download my video. It’s looking good. Except the audio starts about three seconds before the video. I try again. Same story. I look at video on the camera: audio and video perfectly synchronised.
Decide I need coffee, but we are out of coffee, so nip across the road. Weird look from shopkeeper reminds me that I am make-up and jewellery on top half and tracksuit on bottom half. Coffee in hand, I regroup. No advice on out-of-sync films in the manual or on the website of the camera-maker, which is complex, confusing and looks unlikely to resolve my problems.  Try Google. There seem to be only a tiny handful of people out there who’ve had the same problem, and the replies they’ve had are not encouraging. One man had shot 20 hours of film before realising the problem, so I reckoned I was lucky in comparison to him. One suggestion to him was to get into an editing program that would allow him to shuffle along the audio track.  I dimly remember using some video editing software in the past that allowed me to separate the audio and video stream on a file. Hunt through all my software, and locate Windows Moviemaker. This is encouraging, except it doesn’t seem able to read mp4 files.
In the back of my mind, there’s a concern that maybe the problem is due to the microphone. Now, this is what happens to me when I encounter a succession of obstacles: I start calm and logical, but I then start to think that there’s a malign force out there chuckling over my misfortunes, and I lose the plot and move over to magical thinking. If the problem was the microphone, then my logical brain tells me that the video should be out of sync when viewed on the camera. But a little voice in my head is telling me I should try with a different microphone, and so off I go on a futile and time-consuming exercise. I have another microphone that’s attached to a headset. So I unplug the recorder from the computer USB port. In response, computer gives me blue screen of death. Switch off computer. Reboot. Relieved to find it still works okay.
So I return upstairs to my living room to record two new brief segments, one with original microphone and one with headset microphone. I come downstairs, I plug camera into USB port. Blue screen of death returns. Reboot computer. It won’t start. Realise that this might be due to camera in USB port. Remove camera. Computer starts OK. Gingerly put camera in USB port. This time it’s okay, and I download my two trial clips. Both download okay. But when I play them, I realise there’s a fatal flaw to my test. I recorded clips with me talking, but did not record my face. So I have no idea whether or not the audio is in sync with the video.
Upstairs again to re-record. Ultimately, this futile test confirms that both microphones give an in-sync film on the camera, which mysteriously transforms into an out-of-sync version on my computer.
I have a faint memory of things called codecs, which determine how audio and video is converted into a digital form. Maybe I don’t have the right codecs. At this point, a more sensible test occurs to me. I should try downloading on to a different computer. Husband who is peacefully working in his office at top of the house is willing to lend me a laptop, which I carry to my office at bottom of house. It takes a very long time to boot up, and once it’s done that, I can’t get the mouse to work. Try pressing buttons etc. No joy. Further consultation with husband. Decide to replace battery in mouse. We have batteries, but they are defended by packaging. Further hunt for scissors. Get battery. Replace battery. Mouse now works. Plug in camera. Download software. Restart. Get message telling me to download updated software and decide this may be a good idea, so do that and again restart. This is a computer that takes a good 5 minutes to boot up and to shut down. Make a cup of tea while all this is going on. And, joy oh joy, when I have got software installed and downloaded the video, it works. It is in sync! I have to edit it to chop off the first and last bits, where I am walking from the camera to the chair and back, and so I find the manual which explains how to do that, but I’m in a hurry, as we are going out for the evening, and somehow, I manage to do the opposite of what I intended, so am left with just the end of the film, which is a bit I wanted to discard. Still, I think, we’re getting there. Tomorrow is another day.
A new day dawns. I download the film to husband’s computer one more time. This time I do succeed in selecting the right portion to save, and create a file that we’ll be able to download to YouTube. But I’d really like to back it up on my computer, and there’s a problem. It’s too big to email, too big for Dropbox, and won’t fit on a memory stick. I used to have several pocket drives, but I blew up a couple of them by using the wrong power supply, and the others are at work. Hunt of the house eventually yields a pocket driving belonging to husband (who is amassing marital points at an unprecedented rate during this exercise) and transfer the video to my computer. But when I play it, the audio is out of sync with the video.
Now, although this is disappointing, I’m not sure whether it’s good news or bad news. The good news is that the file is clearly fine when played on either the camera or my husband’s PC. So the problem is with my PC and how it is interpreting the file. So I feel I have to get to grip with codecs again. The software has actually told me which codecs were used with the file, and I make a note of them. Googling the IDs leads me to a website that has oodles of codecs that you can download. A bit more Googling allows me to find out how to see which codecs are already installed on my machine. But now I have a quandary. It’s not clear to me that the codec download site is safe, and a bit more Googling confirms my worries. It seems that you can end up far worse than you started if you download a dodgy codec. So I have a new idea. I’ll try the Microsoft site and see what it says about codecs. What it says is possibly the least helpful advice I have ever seen. It suggests you search on the internet for the codecs you need, but it then says that it can be really, really dangerous to download codecs from the internet, and warns you against it.
Well, I think, maybe if I download an up-to-date version of Moviemaker, it might come with useful codecs. On to the Microsoft site. Yes, there’s a more recent version of Moviemaker, and I initiate the download process. But then it demands verification via Microsoft Genuine Advantage. This rings faint bells as something I decided not to sign up for, having read reviews that suggested it could slow up your machine. I think that maybe I should give it a try, but when I try to do so I ultimately get to a website that explains that the page isn’t working and Microsoft is aware of the problem.
I decide that, rather than wasting time on a fruitless hunt for a safe codec, I will shoot one more bit of footage. Once again, make-up, nice top, pearls. Part of me wonders whether there’s any point to this, and whether I should not instead adopt the Mary Beard approach of appearing au naturel. It definitely works for Mary, who is widely adored for her robust attitude to those who think she should have a make-over for TV. But I decide that I can’t now change tack, as it would really look weird if one bit of view had me all glammed up and the next one had the normal scruffy Bishop. The first two takes are fluffed, but the third is perfect. Except that when I try to stop the recording, the device is frozen. No buttons at all work, even the off switch. I’m starting to get emotional but have to try not to cry as it would just make my makeup run (another good reason for adopting the au naturel approach). The manual is singularly unhelpful - its advice on problems is restricted to occurrences such as having one’s finger in front of the viewfinder. Googling doesn’t help either. All my experiences seem unique to me  - further evidence of the malign force. Only solution, I guess, is to remove the battery. That restores the camera to normal functioning, but the last, perfect, take is described as “file type unknown”.
Back upstairs for yet another session. Eventually manage a version that seems okay, which I download successfully. And which looks fine on husband’s laptop but out-of-sync on mine. Thankfully get back into tracksuit, remove makeup, and decide I will reward myself with a negroni and an episode of the Bridge.
If these videos do ever get onto the RALLI site, you may think that I look a bit stressed for someone who’s just doing a three-minute piece. But now you know the true story.

Sunday, 6 May 2012

Sharing of MRI dyslexia datasets


One of the great things about blogging is that it allows for communication to proceed far more rapidly than would be possible through conventional academic publications. In previous posts I’ve made a plea for MRI researchers to share data so that claims about the neurobiology of conditions such as dyslexia and autism can be replicated. After my last blogpost, I was contacted by Mark Eckert from the Medical University of South Carolina, one of the pioneers of MRI studies of dyslexia (e.g. Eckert et al, 2005). He tells me that a data-sharing project on dyslexia is already underway and asked if I would be able to share this information with my followers. I am of course delighted to do so! Here is some background from Mark:
The structural neuroimaging literature on dyslexia and other complex disorders is filled with inconsistent results.  Meta-analysis provides a mechanism for identifying results that are common across studies, but direct analysis of the same datasets provides greater power, methodological consistency, and new analysis opportunities that include taking advantage of the behavioral and neural heterogeneity that is often problematic in small samples.  For those reasons, there is a growing interest in sharing data.  Prospective multi-site studies are ideal because the same data collection and quality control procedures can be used across sites.  These studies tend to be very expensive, however.  Retrospective studies take advantage of existing datasets that are housed in dusty hard drives, but are limited by methodological inconsistencies across sites.  A new NIH supported project, directed by Mark Eckert, uses dyslexia as a model to address the challenges facing retrospective multi-site studies.  Methods are being developed in this project to address subject privacy, behavioral heterogeneity in dyslexia and control samples, missing data, and the underestimation of the variance in datasets when pooling data across different research sites.  His research group is collecting existing neuroimaging datasets and aims to have more than 2000 pediatric and adult cases from reading disability studies.  One long term goal of this project is to make available much of the data collected for this study so that scientists can ask new questions, apply new methods to the data, and develop new collaborations with other scientists who have complementary expertise and interests in reading disability.  There are incentives for research groups to contribute data. For example, contributors will be included in a Dyslexia Data Consortium that will be included in the list of authors for manuscripts stemming from this project.  If you are interested in learning more about the study and/or would like to contribute data, please contact Mark Eckert at dyslexia @ musc.edu.
Eckert MA, Leonard CM, Wilke M, Eckert M, Richards T, Richards A, & Berninger V (2005). Anatomical signatures of dyslexia in children: unique information from manual and voxel based morphometry brain measures. Cortex; a journal devoted to the study of the nervous system and behavior, 41 (3), 304-15 PMID: 15871596

Wednesday, 2 May 2012

Neuronal migration in language learning impairments: a suggestion

Specific language impairment (SLI) and dyslexia are related developmental disorders in which a child has difficulty learning to talk (SLI) or to read (dyslexia). Many children have both problems, although they can occur separately (Bishop & Snowling, 2004), and they are sometimes grouped together as ‘language learning impairments’. There's good evidence that genes are implicated in causing these conditions (Bishop, 2009).
A popular account maintains that the genes implicated in language learning impairments affect a very early process in the developing brain known as neuronal migration (Galaburda et al., 2006). It’s an attractive theory that has the potential to provide a link from genes to behaviour. However, when I looked at the evidence, I found myself not entirely convinced. Here I’ll briefly review research on this topic, explain my reservations, and conclude by proposing a study that needs doing. I’m not an expert in neuroanatomy or neuroimaging, so I’ll be interested to see if others think this proposal is sensible.
Abnormalities found in 1979 case report. Solid circles show ectopias/dysplasias, and shaded area shows micropolygyria (based on Galaburda et al, 1985) .
Over thirty years ago, Galaburda and Kemper published a post mortem study of the brain of a man with developmental dyslexia who died from an accidental fall at the age of 20 years. He’d had delayed language development, and was diagnosed with dyslexia in the first grade. His Stanford-Binet IQ of 105 was well in advance of his reading attainments. He developed epilepsy at 16 years of age. His brain showed areas of displaced neurons (ectopias) in the left cerebral hemisphere, especially around the left planum temporale. There was also an area of polymicrogyria, i.e. excessive number of small convolutions, giving a lumpy appearance to the cortex. This raised the possibility that we might find the origins of dyslexia not in the gross features of brain structure, but at the microscopic level, in the organisation of neurons. However, as the authors noted: “It is not possible to tell from a single case whether or not the anatomical findings have any causative relationship to the clinical findings – much less whether the malformation is responsible for the seizure disorder, the learning disability, both, or neither” (p. 99). They also noted that the kinds of neuroanatomical abnormality that they found in their patient were probably too rare to explain dyslexia in general, which has a prevalence of around 5-10% in the population.
A subsequent report added further evidence for a link to dyslexia (Galaburda et al, 1985). Similar abnormalities were found in three further post-mortem cases, and in none of these was epilepsy described, though one had delayed speech and one had “notable language difficulties”. Three additional cases, this time of female dyslexics, were reported by Humphreys et al (1990), but these were less compelling: the evidence for migrational abnormalities was less strong, and other pathologies could have been implicated.
There’s a general problem with the methodology of these studies, which is that they were not conducted blind. The cellular abnormalities that were described require an expert eye and clinical judgement, and you wouldn’t necessarily see them unless you were looking for them. Could they just be spurious findings? Galaburda and colleagues noted that similar anomalies are sometimes reported as incidental findings in unselected autopsy brains, and so a key question was whether the findings in dyslexic brains were really unusual. Accordingly, Kaufman and Galaburda (1989) analysed ten control brains using identical procedures to those used for dyslexic brains. They found abnormal cells in three control brains, but the anomalies were far less numerous than those seen in the dyslexic brains. This provides useful context, but ideally, we need a study where the neuroanatomist is given both dyslexic and control brains and asked to analyse them without knowing which was which, to avoid the perceptual and cognitive biases that can affect even the most scrupulous of observers.
The anomalies described by Galaburda and colleagues reflect disruption at an early stage of brain development, when neurons are being formed and organised into coherent structures. This website from Pasco Rakic has some nice animations showing how a brain is formed when neurons are first generated in the foetus. Neurons formed in the ventricular zone travel out to the surface of the cortex along radial glial fibres, gradually building up six distinct layers of the cortex from the inside out. Studies with rodents, and evidence from humans with developmental disorders, indicate that this process can be disrupted in a range of ways. In some people, a proportion of cells fail to migrate at all, and can be seen as clusters of abnormal cells around the ventricles. This condition, known as periventricular heterotopia, does not normally impair cognitive function but does cause epilepsy. In other cases, there is partial migration followed by arrest, leading to lissencephaly, typically associated with epilepsy and severe intellectual impairment(Guerrini& Parrini, 2010). In mice, a naturally-occurring genetic mutation leads to the phenotype of the reeler mouse, which has severe motor co-ordination problems linked to disorganisation of the usual laminar structure of the cortex, because the migrating neurons fail to penetrate to the surface of the brain. The cases studied by Galaburda and colleagues had a range of anomalies, described as ectopias, dysplasias, heterotopias, ‘brain warts’ and polymicrogyria, associated with disruption affecting different stages of neuronal migration and postmigrational development (Barkovich et al, 2012).
What makes this work exciting is a potential link to genetic studies of dyslexia. There are replicated associations of dyslexia with several genes, including DYX1X1, KIAA0319, DCDC2 and ROBO1. As Galaburda et al (2006) noted in their review, mutations of these genes have been linked to migrational anomalies in rodents. It looks, therefore, as though the route from brain to behaviour could be neatly explained by postulating a genetic influence on neuronal migration that leads to a brain that is not optimally connected.
Some puzzles, however, remain. First, the genetic variants associated with dyslexia are not mutations. They are common in the general population. Associations with dyslexia are found in studies with very large samples, but they are not very strong. For instance, one can deduce from the published data on the KIAA0319 locus that there is a low-risk version of the gene that is found in 39% of normal readers and 25% dyslexics, and a high-risk version that is found in 30% of normal readers and 35% dyslexics. If the dyslexic risk variant causes anomalies of neuronal migration, then we should see lots of people with those anomalies, many (most) of whom will not be dyslexic. Of course, it is all a matter of degree; it is possible that each risk variant has only minor effects on neuronal migration, and causes problems only if it occurs in conjunction with other genetic or environmental risks. Neuronal migration can be affected by environmental factors, such as toxins, nutrition, and disease or trauma affecting the brain. So the ubiquity of these risk alleles does not rule out a causal route via neuronal migration mechanisms, but it does make the story more complicated.
What if we look at the association between neuronal migration disorders and dyslexia from the other direction, i.e. assessing reading ability in individuals with known migrational abnormalities? Chang et al (2005) did this in people with periventricular nodular heterotopia - a disorder in which a proportion of neurons fail to migrate from the ventricular zone. Most of their participants had normal range IQ. On the Wide Range Achievement tests of reading and spelling, their mean scores were average or above-average. Many of them did, however, do poorly on the Nelson-Denny reading test and on this basis, the authors concluded they were dyslexic. But this test, which stresses speed, was designed for college students, not for the general population. The fact that most participants were older than college students, and all were on anti-epileptic medication, makes the claim of dyslexia in these people far from convincing. Minimally, this study should have included a comparison group to control for age, background and medication status.
A final issue is why migrational abnormalities haven’t been noted in MRI studies of dyslexia. In studies of children with specific language impairments, a Brazilian group has reported remarkably high rates of polymicrogyria (De Vasconcelos Hage et al, 2006). However, this does not seem to be a general explanation for SLI. My colleagues tell me there were no cases of this in people with SLI who participated in a recent MRI study that we published, and none was mentioned in a series reported by Webster etal (2008). MRI studies of dyslexia have been considerably more numerous, yet, as far as I can establish, none has mentioned migrational anomalies. Of course, many MRI studies focus on averaged data, which would mask individual variations. So, a key question is whether the failure to report migrational abnormalities in MRI studies is because (a) no-one was looking for them, (b) they are too subtle to see on regular MRI scan, or (c) they aren’t involved in most cases of language learning impairments.
I was intrigued by this question, so I looked for literature on detectability of neuronal migration anomalies on MRI scan. My impression is that these wouldn’t necessarily be detected unless you were looking for them, and if you were, detectability depends on the type and location of anomalies. Wagner et al (2011) devised an automated method of MRI analysis that was successful in picking up 82% of Type IIA cortical dysplasias and 92% of Type IIB, compared to 65% and 91% detected by an expert neuroradiologist. Periventricular nodular heterotopia seems a more obvious pathology that is routinely detected on MRI scan.
On this basis, I’d say there’s a study out there crying out to be done. There are plenty of reports of MRI scans comparing dyslexic vs control brains. We could revisit those scans using the automated methods developed by Wagner et al to test the hypothesis that the rate of neuromigrational anomalies is higher in the dyslexic vs control samples. It’s clear that MRI scans won’t pick up everything, and subtle anomalies may be missed. However, if the neuronal migration account of language learning impairments is correct, we should nevertheless expect to see a measureable difference in the rates of anomalies between cases of dyslexia/SLI vs. controls. And if genetic information is available as well, then a comparison could be done between those with and without risk variants.

References
Barkovich, A. J., Guerrini, R., Kuzniecky, R. I., Jackson, G. D., & Dobyns, W. B. (2012). A developmental and genetic classification for malformations of cortical development: update 2012. Brain, 135(5), 1348-1369. doi: 10.1093/brain/aws019
Bishop, D. V. M. (2009). Genes, cognition and communication: insights from neurodevelopmental disorders. The Year in Cognitive Neuroscience: Annals of the New York Academy of Sciences, 1156, 1-18.
Bishop, D. V. M., & Snowling, M. J. (2004). Developmental dyslexia and Specific Language Impairment: Same or different? Psychological Bulletin, 130, 858-886.
Chang, B. S., Ly, J., Appignani, B., Bodell, A., Apse, K. A., Ravenscroft, R. S., . . . Walsh, C. A. (2005). Reading impairment in the neuronal migration disorder of periventricular nodular heterotopia. Neurology, 64(5), 799-803.
De Vasconcelos Hage, S. R., Cendes, F., Montenegro, M. A., Abramides, D. V., Guimarães, C. A., & Guerreiro, M. M. (2006). Specific language impairment: linguistic and neurobiological aspects. Arquivos de Neuro-Psiquiatria, 64, 173-180.
Galaburda, A. M., & Kemper, T. (1979). Cytoarchitectonic abnormalities in developmental dyslexia. Annals of Neurology, 6, 94-100.
Galaburda, A. M., Sherman, G. F., Rosen, G. D., Aboitiz, F., & Geschwind, N. (1985). Developmental dyslexia: four consecutive cases with cortical anomalies. Annals of Neurology, 18, 222-233.
Galaburda, A. M., LoTurco, J. J., Ramus, F., Fitch, R. H., & Rosen, G. D. (2006). From genes to behavior in developmental dyslexia. Nature Neuroscience, 9, 1213-1217.
Guerrini, R., & Parrini, E. (2010). Neuronal migration disorders. Neurobiology of Disease, 38, 154-166.
Wagner, J., Weber, B., Urbach, H., Elger, C., & Huppertz, H. (2011). Morphometric MRI analysis improves detection of focal cortical dysplasia type II Brain, 134 (10), 2844-2854 DOI: 10.1093/brain/awr204

Webster, R. I., Erdos, C., Evans, K., Majnemer, A., Saigal, G., Kehayia, E., . . . Shevell, M. I. (2008). Neurological and magnetic resonance Imaging findings in children with developmental language impairment. Journal of Child Neurology, 23(8), 870-877. doi: 10.1177/0883073808315620 

Friday, 20 April 2012

Getting genetic effect sizes in perspective


My research focuses on neurodevelopmental disorders - specific language impairment, dyslexia, and autism in particular. For all of these there is evidence of genetic influence. But the research papers reporting relevant results are often incomprehensible to people who aren’t geneticists (and sometimes to those who are).  This leaves us ignorant of what has really been found, and subject to serious misunderstandings.
Just as preamble, evidence for genetic influences on behaviour comes in two kinds. The first approach, sometimes referred to as genetic epidemiology or behaviour genetics allows us to infer how far genes are involved in causing individual differences by studying similarities between people who have different kinds of genetic relationship. The mainstay of this field is the twin study. The logic of twin studies is pretty simple, but the methods currently used to analyse twin data are complex. The twin method is far from perfect, but it has proved useful in helping us identify which conditions are worth investigating using the second approach, molecular genetics.
Molecular genetics involves finding segments of DNA that are correlated with a behavioural (or other phenotypic) measure. It involves laboratory work analysing biological samples of people who’ve been assessed on relevant measures. So if we’re interested in, say, dyslexia, we can either look for DNA variants that predict a person’s reading ability - a quantitative approach - or we can look for DNA variants that are more common in people who have dyslexia. There’s a range of methods that can be used, depending on whether the data come from families - in which case the relationship between individuals can be taken into account - or whether we just have a sample of unrelated people who vary on the behaviour of interest, in this case reading ability.
The really big problem comes from a tendency in molecular genetics to focus just on p-values when reporting findings. This is understandable: the field of molecular genetics has been plagued by chance findings. This is because there’s vast amounts of DNA that can be analysed, and if you look at enough things, then the odd result will pop up as showing a group difference just by chance. (See this blogpost for further explanation). The p-value indicates whether an association between a DNA variant and a behavioural measure is a solid finding that is likely to replicate in another sample.
But a p-value depends on two things: (a) the strength of association between DNA and behaviour (effect size) and (b) the sample size. Psychologists, many of whom are interested in genetic variants linked to behaviour, are mostly used to working with samples that number in the tens rather than hundreds or thousands. It’s easy, therefore, to fall into the trap of assuming that a very low p-value means we have a large effect size, because that’s usually the case in the kind of studies we’re used to. Misunderstanding can arise if effect sizes are not reported in a paper.
Suppose we have a genetic locus with two alleles, a and A, and a geneticist contrasts people with an aa genotype vs those with aA or AA (who are grouped together). We read a molecular genetics paper that reports an association between these genotypes and reading ability with p-value of .001. Furthermore, we see there are other studies in the literature reporting similar associations, so this seems a robust finding. You could be forgiven for concluding that the geneticists have found a “dyslexia gene”, or at least a strong association with a DNA variant that will be useful in screening and diagnosis. And, if you are a psychologist, you might be tempted to do further studies contrasting people with aa vs aA/AA genotypes on behavioural or neurobiological measures that are relevant for reading ability.
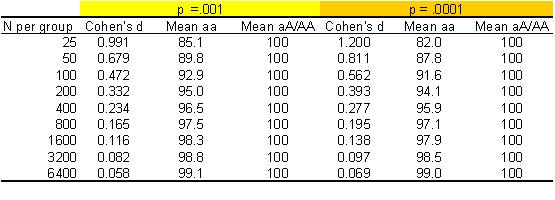
However, this enthusiasm is likely to evaporate if you consider effect sizes. There is a nice little function in R, compute.es, that allows you to compute effect size easily if you know a p-value and a sample size. The table below shows:
  •  effect sizes (Cohen’s d, which gives mean difference between groups in z-score units)
  •  average for each group for reading scores scaled so the mean for the aA/AA group is 100 with SD of 15
Results are shown for various sample sizes with equal numbers of aa vs aA/AA and either p =.001 or p = .0001. (See reference manual for the R function for relevant formulae, which are also applicable in cases of unequal sample size). For those unfamiliar with this area, a child would not normally be flagged up as having reading problems unless a score on a test scaled this way was 85 or less (i.e., 1 SD below the mean).

Table 1: Effect sizes (Cohen’s d) and group means derived from p-value and sample size (N)


When you have the kind of sample size that experimental or clinical psychologists often work with, with 25 participants per group, a p of .001 is indicative of a big effect, with a mean difference between groups of almost one SD. However, you may be surprised at how small the effect size is when you have a large sample. If you have a sample of 3000 or so, then a difference of just 1-2 points (or .08 SD) will give you p < .001. Most molecular genetic studies have large sample sizes. Geneticists in this area have learned that they have to have large samples, because they are looking for small effects!
It would be quite wrong to suggest that only large effect sizes are interesting. Small but replicable effects can be of great importance in helping us understand causes of disorders, because if we find relevant genes we can study their mode of action (Scerri & Schulte-Korne, 2010). But, as far as the illustrative data in Table 1 are concerned, few psychologists would regard the reading deficit associated at p of .001 or .0001 with genotype aa as of clinical significance, once the sample size exceeds 1000 per group.
Genotype aa may be a risk factor for dyslexia, but only in conjunction with other risks. On its own it doesn’t cause dyslexia.  And the notion, propagated by some commercial genetics testing companies, that you could use a single DNA variant with this magnitude of effect to predict a person’s risk of dyslexia, is highly misleading.


Further reading
Flint, J., Greenspan, R. J., & Kendler, K. S. (2010). How Genes Influence Behavior: Oxford University Press.
Scerri, T., & Schulte-Körne, G. (2009). Genetics of developmental dyslexia European Child & Adolescent Psychiatry, 19 (3), 179-197 DOI: 10.1007/s00787-009-0081-0

If you are interested in analysing twin data, you can see my blog on Twin Methods in OpenMx, which illustrates a structural equation modelling approach in R with simulated data.

Update 21/4/12: Thanks to Tom Scerri for pointing out my original wording talked of "two versions of an allele", which has now been corrected to "a genetic locus with two alleles"; as Tom noted: an allele is an allele, you can't have two versions of it.
Tom also noted that in the table, I had taken the aA/AA genotype as the reference group for standardisation to mean 100, SD 15. A more realistic simulation would take the whole population with all three genotypes as the reference group, in which case the effect size would result from the aA/AA group having a mean above 100, while the aa group would have mean below 100. This would entail that, relative to the grand population average, the averages for aa would be higher than shown here, so that the number with clinically significant deficits will be even smaller.
I hope in future to illustrate these points by computing effect sizes for published molecular genetic studies reporting links with cognitive phenotypes.

Thursday, 12 April 2012

The ultimate email auto-response

Prague Humor
Photo credit: szeke

Andy Field (who actually gave me a v. helpful response to a query via Twitter...) demonstrates how it should be done:

12 April 2012 06:34
This is an automatic reply.

I'm on study leave writing 'Discovering Statistics Using SPSS 4'. This essentially means that I'm locked in a mental Dungeon for the next 6 months in which intrusions from the outside world are like needles lancing my brain. They hurt, and hence I'm going to ignore them. If you really need to get hold of me then you should write a letter and insert it into the stale bread that they push through my cell door every morning. Or you can follow my demented ramblings (or 'progress' as some people call it) on Facebook and Twitter.

I will start to emerge back into reality (some might argue I was never in it) sometime in April 2012, at which point please resend your email if you still require a response.

Monday, 9 April 2012

BBC's 'extensive coverage' of the NHS bill

Last month, there was a remarkable disconnect between what was being reported on BBC News outlets and what was concerning many members of the public on social media. The Health and Social Care Bill was passed by Parliament on 21st March, despite massive objections from many of those working in the NHS, and those members of the general public who were aware of the bill. Evidence of this concern was apparent from the fact that a petition with 486,000 signatures was presented to the Lords by Lord David Owen on 19th March, supporting his view that consideration of the Bill should be deferred until after the Risk Register had been published. There had also been a rally on 7th March attended by thousands of NHS workers. During the month of March, when there was still an opportunity of killing the bill if the Liberal Democrats had come out against it, there appeared to be very little coverage of it by the BBC. Only after the Bill had been passed, did the BBC seem willing to run it as a news item.
There has been a fair bit of commentary on the lack of coverage, with some suggesting there may have been a deliberate conspiracy to keep quiet because of political pressures and/or vested interests of BBC executives in private health providers.
http://salt-mine.net/blog/2012/03/23/complaint-bbcqt-no-question-nhs-bill/ 
http://storify.com/isobelweinberg/bbc-coverage-of-the-nhs-bill 
http://caiwingfield.com/cms/2012/03/police-suppression-of-peaceful-pro-nhs-protest-march-17th-2012/
http://socialinvestigations.blogspot.co.uk/2012/03/lord-patten-of-barnes-bridgepoint-and.html
Like many people, I submitted a complaint to the BBC about their lack of coverage of this important topic. I received a prompt reply as follows:
Dear Dorothy 
Thank you for contacting us regarding BBC News coverage. We understand you believe BBC News did not sufficiently report on the opposition to the Health and Social Care Bill. BBC News has reported extensively on the opposition to the Health and Social Care Bill across our news programmes and bulletins since the Bill was originally proposed. We have reported on the health, political and business dimensions of the debate during our flagship news programmes and news bulletins and have heard from politicians, NHS workers, public sector workers and members of the public alike, as well as from supporters of the bill. There have been numerous protests and demonstrations held in opposition to the Government’s proposals. Such shows of opposition have been varied in size and were spread across the different stages of the bill’s formation. We believe we have accurately and fairly reflected the nature of this opposition in our news coverage. While you were unhappy about the level of coverage given to this, the political opposition to the Bill culminated in the House of Commons emergency debate on 20 March. Accordingly, the Commons debate featured heavily in our news coverage on the day and was the lead story during our main news bulletins. The Health and Social Care bill has been one of the biggest UK stories over the past few months and we believe we have afforded it the appropriate level coverage in a fair and impartial manner, allowing viewers and listeners to make up their own minds on the matter at hand
The phrase ‘extensive coverage’ did not reflect my impressions. I am not glued to the BBC, but I am a regular listener to the Radio 4 Today Programme and I was not aware of the NHS bill receiving any coverage at all. I therefore submitted a follow-up complaint asking if they could please give me details of specific programmes when the BBC had covered the NHS bill during the month of March. Again, they replied promptly and courteously. And here is what they said (with relevant sections from the websites in blue):
Dear Dr Bishop
We understand that you would like details of when opposition to the Health and Social Care Bill was covered by the BBC. Opposition to the bill has been covered on various programmes across the BBC, for example; Newsnight, The Daily Politics, Today and BBC News Online. Opposition was also covered on 'Newsnight' during a report on 9th March which looked at Liberal Democrat activist's plans to derail the bill and on the 13th March during a discussion on the future of the welfare system. A report on the 'The Daily Politics' broadcast on 13th March (at 14:09) highlighted opposition from Labour as well as the Royal College of GPs. Diane Abbott said health professionals were still opposed to the Health and Social Care Bill, which could be days away from becoming law. She said a future Labour government would overturn the act and "unpick the worst of the damage". Liberal Democrat spokesman Lord Clement-Jones said the bill was "going to get more acceptance"
More coverage was given on the 'Today' programme on the following dates:  
Sat 10th March, 0712-0714 Liberal Democrat activists will decide this morning whether Nick Clegg will face a vote on the health bill. The BBC's Robin Bryant explains why that could be bad news for the government. 
Weds 21st March, 0840-0853 The government's controversial plans to change the NHS have passed their final hurdle in Parliament after 14 months of opposition and changes in both houses. Professor Chris Ham, chief executive of the health think-tank The King's Fund, looks at what we left with now.
In addition examples of coverage on BBC News Online include: 


So, if I have understood this right,during March, the Today Programme covered the story once, in an early two-minute slot, before the Bill was passed. Other items that morning included 4 minutes on a French theme park based on Napoleon, 6 minutes on international bagpipe day and 8 minutes on Jubilee celebrations.


free counters

Tuesday, 3 April 2012

Phonics screening: sense and sensibility

There’s been a lot written about the new phonics test that is being introduced in UK schools in June. Michael Rosen cogently put the arguments against it on his blog this morning. A major concern is that the test involves asking children to read a list of items, and takes no account of whether they understand them. Indeed, the list includes nonwords (i.e. pronounceable letter strings, such as "doop" or "barg") as well as meaningful words. So children will be “barking at print” - a very different skill from reading for meaning.

I can absolutely see where Rosen is coming from, but he’s missing a key point. You can’t read for meaning if you can’t decode the words. It’s possible to learn some words by rote, even if you don’t know how letters and sounds go together, but in order to have a strategy for decoding novel words, you need the phonics skills. Sure, English is an irritatingly irregular language, so phonics doesn’t always give you the right answer, but without phonics, you have no strategy for approaching an unfamiliar word.
Back in 1990, Hoover and Gough wrote an influential paper in 1990 called “The Simple View of Reading”. This is clearly explained in this series of slides by Morag Stuart from the Institute of Education. It boils down to saying that in order to be an effective reader you need two things: the ability to decode words, and the ability to understand the language in a text. Some children can say the words but don’t understand what they’ve read. These are the ones Michael Rosen is worried about. They won’t be detected by a nonword reading test. They are all-too-often missed by teachers who don’t realise they are having problems because when asked to read aloud, they do fine. There’s a fair bit of research on these so-called “poor comprehenders”, and how best to help them (some of which is reviewed here). But there are other children with the opposite pattern: good language understanding but difficulties in decoding: this corresponds to classic dyslexia. There are decades of research showing that one of the most effective ways of identifying these children is to assess their ability to read novel letter sequences that they haven’t encountered before - nonwords. Nonword reading ability has also been shown to predict which children are at risk for later reading failure.  It's useful precisely because it tests children's ability to attack unfamiliar material, rather than testing what they have already learned. It's a bit like a doctor giving someone a stress test on a treadmill. They may never encounter a treadmill in everyday life, but by observing how they cope with it, the doctor can tell whether they are at risk of cardiovascular problems.

Some children don’t need explicit teaching of phonics - they pick it up spontaneously through exposure to print. But others just don’t get it unless it is made explicit. I’m coming at this as someone who sees children who just don’t get past first base in learning to read, and who fall increasingly far behind if their difficulties aren’t identified. A nonword reading test around age 6 to 7 years will help identify those children who could benefit from extra support in the classroom.
So that’s the rationale, and it is well-grounded in a great deal of reading research. But is there a downside? Potentially, there are numerous risks. It would be catastrophic if teachers got the message from this exercise that reading instruction should involve training children to read lists of words, or worse still, nonwords. Unfortunately, testing in schools is increasingly conflated with evaluation of the school, and so teaching-to-the-test is routinely done. The language comprehension side of reading is hugely important, and shouldn't be neglected. Developing children’s oral language skills is an important component of making children literate. It is also important for children to be read to, and to learn that books are a source of pleasure.
Another concern is children being identified at an early age as failing. The cutoff that is used is crucial, and there are concerns that the bar may be set too high.  Children at real risk are those who bomb on nonword reading, not those who are just a bit below average.
The impact on children’s self-perception is also key. There is already evidence that some primary school children are unduly stressed by SATS. There’s nothing more likely to put a child off reading than being given a test that they don’t understand and being told they’ve failed it. When I was at school, we had the 11+ examination that divided children into those who went to grammar school and those who didn’t. I had friends whose parents promised them a bicycle if they passed - even though there was precious little practice that you could do for the 11+, which was designed to test skills that had not been explicitly taught. Schoolfriends who failed were left with a chip on their shoulder for years. I’d hope that this reading screen is introduced in a more sensitive manner, but the onus is on parents, teachers and the media to ensure this happens. This screening test should serve as a simple diagnostic that will allow teachers to identify those children whose weak letter-sound-knowledge means that they could benefit from extra support. It should not be used to evaluate schools, make children feel they are failures, worry their parents, or support a sterile phonics-only approach to reading.

References
Connor, M. J. (2003). Pupil stress and standard assessment tasks (SATs) An update. Emotional and Behavioural Difficulties, 8(2), 101-107. doi: 10.1080/13632750300507010
Hoover, W. A., & Gough, P. B. (1990). The simple view of reading. Reading and Writing, 2, 127-160.
Nation, K., & Angell, P. (2006). Learning to read and learning to comprehend. London Review of Education, 4(1), 77–87. doi: 10.1080/13603110600574538
Rack, J. P., Snowling, M. J., & Olson, R. K. (1992). The nonword reading deficit in developmental dyslexia. Reading Research Quarterly, 27, 29-53.
Snowling, M., & Hulme, C. (2012). Interventions for children's language and literacy difficulties International Journal of Language & Communication Disorders, 47 (1), 27-34 DOI: 10.1111/j.1460-6984.2011.00081.x

 
free counters