I should start by thanking HEFCE, who are a model of efficiency and transparency: I was able to download a complete table of REF outcomes from their website here.
What I did was to create a table with just the Overall results for Unit of Assessment 4, which is Psychology, Psychiatry and Neuroscience (i.e. a bigger and more diverse grouping than for the previous RAE). These Overall results combine information from Outputs (65%), Impact (20%) and Environment (15%). I excluded institutions in Scotland, Wales and Northern Ireland.
Most of the commentary on the REF focuses on the so-called 'quality' rankings. These represent the average rating for an institution on a 4-point scale. Funding, however, will depend on the 'power' - i.e. the quality rankings multiplied by the number of 'full-time equivalent' staff entered in the REF. Not surprisingly, bigger departments get more money. The key things we don't yet know are (a) how much funding there will be, and (b) what formula will be used to translate the star ratings into funding.
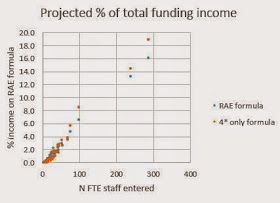
With regard to (b), in the previous exercise, the RAE, you got one point for 2*, three points for 3* and seven points for 4*. It is anticipated that this time there will be no credit for 2* and little or no credit for 3*. I've simply computed the sums according to two scenarios: original RAE, and formula where only 4* counts. From these scores one can readily compute what percentage of available funding will go to each institution. The figures are below. Readers may find it of interest to look at this table in relation to my earlier blogpost on The Matthew Effect and REF2014.
Unit of Assessment 4:
Table showing % of subject funding for each institution depending on funding formula
| Funding formula | ||
| Institution | RAE | 4*only |
| University College London | 16.1 | 18.9 |
| King's College London | 13.3 | 14.5 |
| University of Oxford | 6.6 | 8.5 |
| University of Cambridge | 4.7 | 5.7 |
| University of Bristol | 3.6 | 3.8 |
| University of Manchester | 3.5 | 3.7 |
| Newcastle University | 3.0 | 3.4 |
| University of Nottingham | 2.7 | 2.6 |
| Imperial College London | 2.6 | 2.9 |
| University of Birmingham | 2.4 | 2.7 |
| University of Sussex | 2.3 | 2.4 |
| University of Leeds | 2.0 | 1.5 |
| University of Reading | 1.8 | 1.6 |
| Birkbeck College | 1.8 | 2.2 |
| University of Sheffield | 1.7 | 1.7 |
| University of Southampton | 1.7 | 1.8 |
| University of Exeter | 1.6 | 1.6 |
| University of Liverpool | 1.6 | 1.6 |
| University of York | 1.5 | 1.6 |
| University of Leicester | 1.5 | 1.0 |
| Goldsmiths' College | 1.4 | 1.0 |
| Royal Holloway | 1.4 | 1.5 |
| University of Kent | 1.4 | 1.0 |
| University of Plymouth | 1.3 | 0.8 |
| University of Essex | 1.1 | 1.1 |
| University of Durham | 1.1 | 0.9 |
| University of Warwick | 1.1 | 1.0 |
| Lancaster University | 1.0 | 0.8 |
| City University London | 0.9 | 0.5 |
| Nottingham Trent University | 0.9 | 0.7 |
| Brunel University London | 0.8 | 0.6 |
| University of Hull | 0.8 | 0.4 |
| University of Surrey | 0.8 | 0.5 |
| University of Portsmouth | 0.7 | 0.5 |
| University of Northumbria | 0.7 | 0.5 |
| University of East Anglia | 0.6 | 0.5 |
| University of East London | 0.6 | 0.5 |
| University of Central Lancs | 0.5 | 0.3 |
| Roehampton University | 0.5 | 0.3 |
| Coventry University | 0.5 | 0.3 |
| Oxford Brookes University | 0.4 | 0.2 |
| Keele University | 0.4 | 0.2 |
| University of Westminster | 0.4 | 0.1 |
| Bournemouth University | 0.4 | 0.1 |
| Middlesex University | 0.4 | 0.1 |
| Anglia Ruskin University | 0.4 | 0.1 |
| Edge Hill University | 0.3 | 0.2 |
| University of Derby | 0.3 | 0.2 |
| University of Hertfordshire | 0.3 | 0.1 |
| Staffordshire University | 0.3 | 0.2 |
| University of Lincoln | 0.3 | 0.2 |
| University of Chester | 0.3 | 0.2 |
| Liverpool John Moores | 0.3 | 0.1 |
| University of Greenwich | 0.3 | 0.1 |
| Leeds Beckett University | 0.2 | 0.0 |
| Kingston University | 0.2 | 0.1 |
| London South Bank | 0.2 | 0.1 |
| University of Worcester | 0.2 | 0.0 |
| Liverpool Hope University | 0.2 | 0.0 |
| York St John University | 0.1 | 0.1 |
| University of Winchester | 0.1 | 0.0 |
| University of Chichester | 0.1 | 0.0 |
| University of Bolton | 0.1 | 0.0 |
| University of Northampton | 0.0 | 0.0 |
| Newman University | 0.0 | 0.0 |
P.S. 11.20 a.m. For those who have excitedly tweeted from UCL and KCL about how they are top of the league, please note that, as I have argued previously, the principal determinant of the % projected funding is the number of FTE staff entered. In this case the correlation is .995.

