 My research focuses on neurodevelopmental disorders -
specific language impairment, dyslexia, and autism in particular. For all of these there is evidence of genetic influence. But the research papers
reporting relevant results are often incomprehensible to people who aren’t
geneticists (and sometimes to those who are).
This leaves us ignorant of what has really been found, and subject to
serious misunderstandings.
My research focuses on neurodevelopmental disorders -
specific language impairment, dyslexia, and autism in particular. For all of these there is evidence of genetic influence. But the research papers
reporting relevant results are often incomprehensible to people who aren’t
geneticists (and sometimes to those who are).
This leaves us ignorant of what has really been found, and subject to
serious misunderstandings.
Just as preamble, evidence for genetic influences on
behaviour comes in two kinds. The first approach, sometimes referred to as genetic epidemiology or behaviour genetics allows us to infer
how far genes are involved in causing individual differences by studying
similarities between people who have different kinds of genetic relationship.
The mainstay of this field is the twin study. The logic of
twin studies is pretty simple, but the methods currently used to
analyse twin data are complex. The twin method is far from perfect, but it
has proved useful in helping us identify which conditions are worth
investigating using the second approach, molecular
genetics.
Molecular genetics involves finding segments of DNA that are
correlated with a behavioural (or other phenotypic) measure. It involves laboratory work analysing
biological samples of people who’ve been assessed on relevant measures. So if
we’re interested in, say, dyslexia, we can either look for DNA variants that
predict a person’s reading ability - a quantitative approach - or we can look
for DNA variants that are more common in people who have dyslexia. There’s a range of methods that can be used, depending on whether
the data come from families - in which case the relationship between
individuals can be taken into account - or whether we just have a sample of
unrelated people who vary on the behaviour of interest, in this case reading
ability.
The really big problem comes from a tendency in molecular
genetics to focus just on p-values when reporting findings. This is
understandable: the field of molecular genetics has been plagued by chance
findings. This is because there’s vast amounts of DNA that can be analysed, and
if you look at enough things, then the odd result will pop up as showing a
group difference just by chance. (See this
blogpost for further explanation). The p-value indicates whether an association between a DNA variant and a behavioural measure is a solid finding that is likely to replicate in another sample.
But a p-value depends on two things: (a) the strength of
association between DNA and behaviour (effect size) and (b) the sample size.
Psychologists, many of whom are interested in genetic variants linked to
behaviour, are mostly used to working with samples that number in the tens
rather than hundreds or thousands. It’s easy, therefore, to fall into the trap
of assuming that a very low p-value means we have a large effect size, because
that’s usually the case in the kind of studies we’re used to. Misunderstanding can arise if effect sizes are not reported in a paper.
Suppose we have a genetic locus with two alleles, a and A, and a
geneticist contrasts people with an aa
genotype vs those with aA or AA (who are grouped together). We read a
molecular genetics paper that reports an association between these genotypes
and reading ability with p-value of .001. Furthermore, we see there are other
studies in the literature reporting similar associations, so this seems a
robust finding. You could be forgiven for concluding that the geneticists have
found a “dyslexia gene”, or at least a strong association with a DNA variant
that will be useful in screening and diagnosis. And, if you are a psychologist,
you might be tempted to do further studies contrasting people with aa vs aA/AA genotypes on behavioural or neurobiological measures that are
relevant for reading ability.
However, this enthusiasm is likely to evaporate if you
consider effect sizes. There is a nice little function in R, compute.es, that allows you to compute
effect size easily if you know a p-value and a sample size. The table below
shows:
- effect sizes (Cohen’s d, which gives mean difference between groups in z-score units)
- average for each group for reading scores scaled so the mean for the aA/AA group is 100 with SD of 15
Results are shown for various sample sizes with equal numbers of aa vs aA/AA and
either p =.001 or p = .0001. (See reference manual for the R function for relevant formulae, which are also applicable in
cases of unequal sample size). For those unfamiliar with this area, a child
would not normally be flagged up as having reading problems unless a score on a
test scaled this way was 85 or less (i.e., 1 SD below the mean).
Table 1: Effect sizes
(Cohen’s d) and group means derived from p-value and sample size (N)
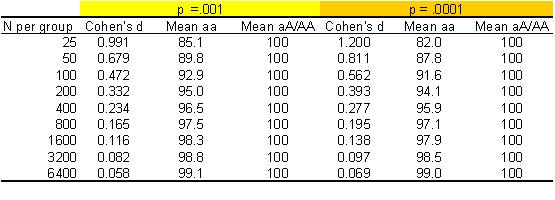
When you have the kind of sample size that experimental or clinical psychologists often work with, with 25 participants per group, a p of .001 is indicative of a big effect, with a mean difference between groups of almost one SD. However, you may be surprised at how small the effect size is when you have a large sample. If you have a sample of 3000 or so, then a difference of just 1-2 points (or .08 SD) will give you p < .001. Most molecular genetic studies have large sample sizes. Geneticists in this area have learned that they have to have large samples, because they are looking for small effects!
It would be quite wrong to suggest that only large effect
sizes are interesting. Small but replicable effects can be of great importance
in helping us understand causes of disorders, because if we find relevant genes
we can study their mode of action (Scerri & Schulte-Korne, 2010). But, as far as the illustrative data in Table 1 are concerned,
few psychologists would regard the reading deficit associated at p of .001 or
.0001 with genotype aa as of clinical
significance, once the sample size exceeds 1000 per group.
Genotype aa may be a risk factor for dyslexia, but only in
conjunction with other risks. On its own it doesn’t cause dyslexia. And the
notion, propagated by some commercial genetics testing companies, that you
could use a single DNA variant with this magnitude of effect to predict a
person’s risk of dyslexia, is highly misleading.
Further reading
Flint,
J., Greenspan, R. J., & Kendler, K. S. (2010). How Genes Influence
Behavior: Oxford University Press.
Scerri, T., & Schulte-Körne, G. (2009). Genetics of developmental dyslexia European Child & Adolescent Psychiatry, 19 (3), 179-197 DOI: 10.1007/s00787-009-0081-0
If you are interested in analysing twin data, you
can see my blog on Twin Methods in
OpenMx, which illustrates a structural equation modelling approach in R
with simulated data.
Update 21/4/12: Thanks to Tom Scerri for pointing out my original wording talked of "two versions of an allele", which has now been corrected to "a genetic locus with two alleles"; as Tom noted: an allele is an allele, you can't have two versions of it.
Tom also noted that in the table, I had taken the aA/AA genotype as the reference group for standardisation to mean 100, SD 15. A more realistic simulation would take the whole population with all three genotypes as the reference group, in which case the effect size would result from the aA/AA group having a mean above 100, while the aa group would have mean below 100. This would entail that, relative to the grand population average, the averages for aa would be higher than shown here, so that the number with clinically significant deficits will be even smaller.
I hope in future to illustrate these points by computing effect sizes for published molecular genetic studies reporting links with cognitive phenotypes.


Cohen's d is an example of a standardised effect size - a particular kind of effect size. Sometimes effect sizes expressed in original units are more meaningful.
ReplyDeleteFor instance in a WM training study, number of items recalled in trained and control groups would probably be easier to interpret than would be d.
Can be tricky for some phenotypes, I suppose, e.g., when assessed by questionnaire where the units are unclear.
Baguley (2009) discusses these sorts of issues.
Refs
Baguley, T. (2009). Standardized or simple effect size: What should be reported? British Journal of Psychology, 100, 603–617.